BerriAI / litellm
github.com·3d ago
TL;DR
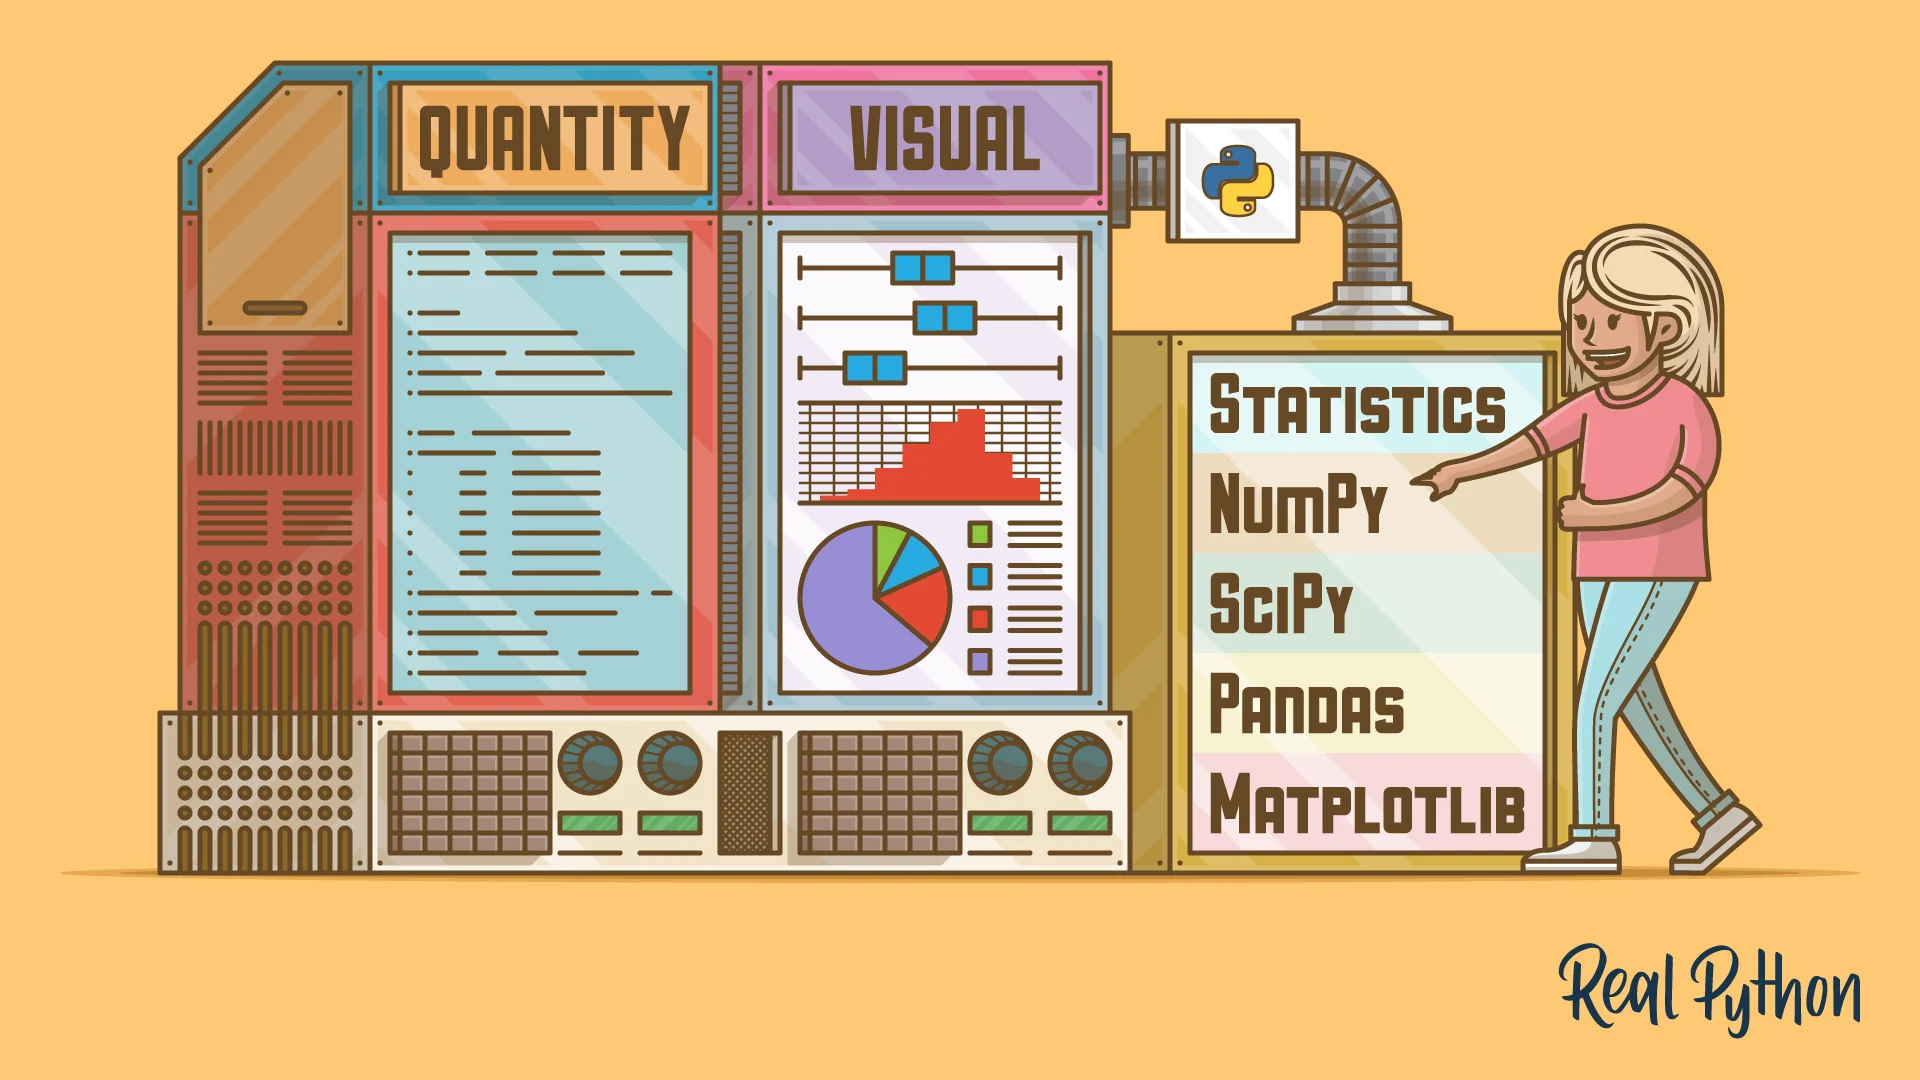
Python offers powerful libraries like NumPy, SciPy, and pandas for effectively describing and summarizing datasets. These tools enable users to calculate descriptive statistics and visualize data efficiently.
✦ Why It Matters
Start using Python libraries today to enhance your data analysis and visualization skills.
Key Takeaways
Full Summary
In the context of big data and artificial intelligence, the ability to describe and summarize data is crucial for data scientists and machine learning practitioners. Python's statistics libraries, including NumPy, SciPy, and pandas, provide comprehensive tools for calculating descriptive statistics, which summarize key aspects of datasets.
Descriptive statistics include measures such as mean, median, mode, and standard deviation, which help in understanding data distributions. Users can perform these calculations using pure Python or leverage the functionality of these libraries for more efficient processing.
The article also provides sample code to demonstrate how to implement these techniques, making it easier for users to apply them in their own projects. By mastering these tools, practitioners can enhance their data analysis capabilities and make informed decisions based on their findings.