Agentic data science with the Data Agent Kit
cloud.google.com·6h ago
TL;DR
Matplotlib and Plotly are two popular Python libraries for data visualization, each with distinct strengths. Matplotlib excels in static plots, while Plotly offers interactive visualizations, making it essential to choose based on project needs.
✦ Why It Matters
Evaluate your project's visualization needs to choose the right tool today.
Key Takeaways
Full Summary
Matplotlib is a long-standing Python library known for its flexibility in generating static plots, making it ideal for academic and publication purposes. It provides fine-grained control over plot elements and is often used in conjunction with Seaborn for enhanced aesthetics.
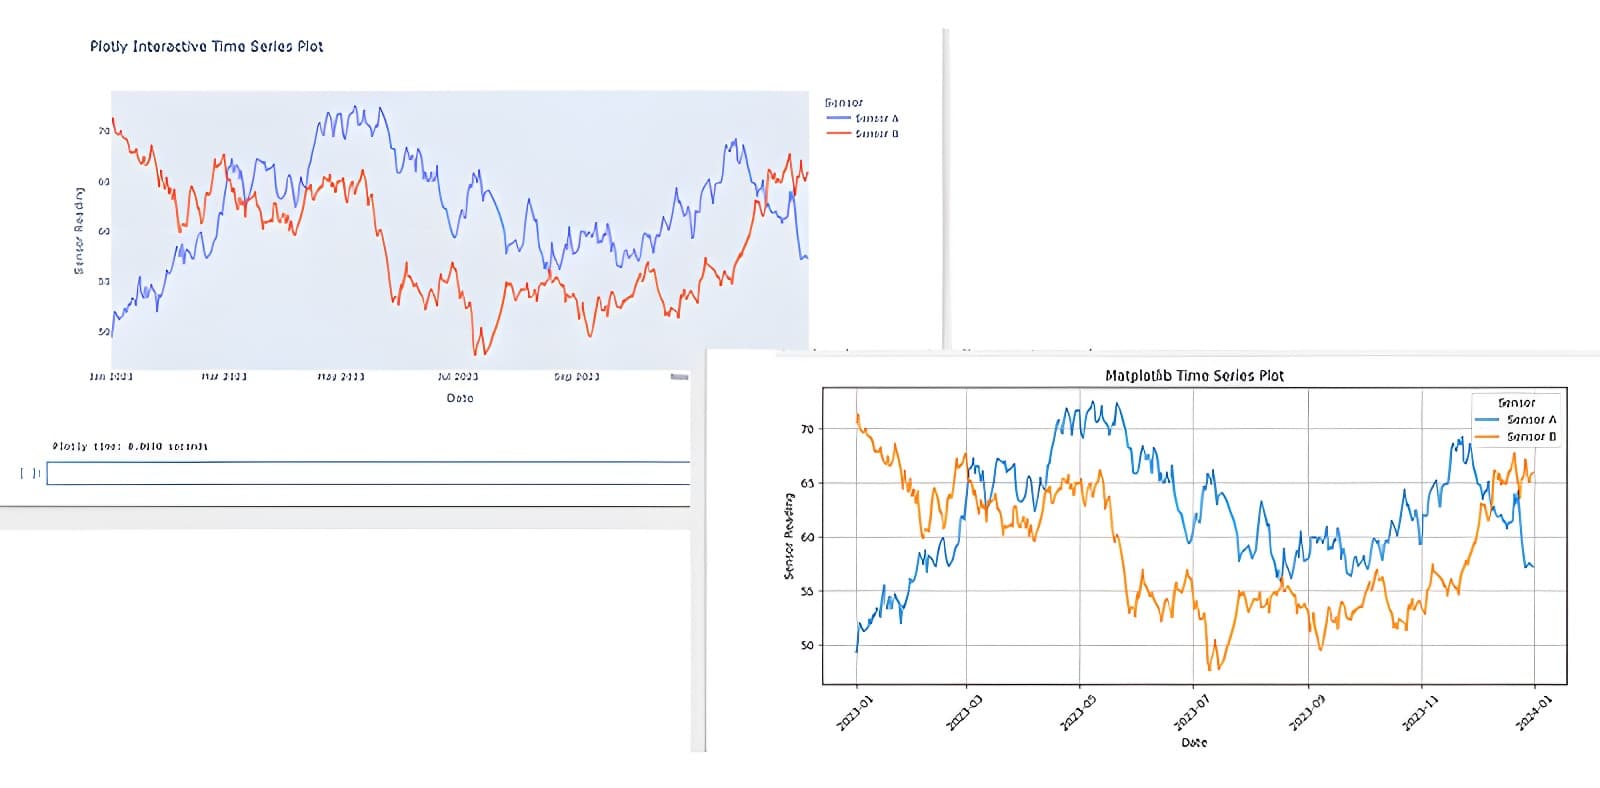
In contrast, Plotly is a modern library that enables the creation of interactive visualizations, allowing users to engage with data through features like zooming, panning, and hovering for details. The article compares both libraries using examples of scatter and line plots, demonstrating that Plotly's interactive capabilities significantly improve user experience.
For instance, Plotly allows users to toggle data series on and off, making it easier to analyze trends. Ultimately, the choice between Matplotlib and Plotly depends on the need for interactivity versus the requirement for static images.
Related